PostgreSQL Log Queries and Audit


Written by
Bastien JovéLast updated on:
June 25, 2025Reading time:
Contents
Built for Security. Loved by Devs.
- Free Trial — No Credit Card Needed
- Full Access to All Features
- Trusted by the Fortune 100, early startups, and everyone in between
There are several reasons why you might want an audit trail of users’ activity on a PostgreSQL database:
- When things go wrong, you need to know what happened and who is responsible
- You store sensitive data, maybe even PII or PHI
- You are subject to compliance standards like SOC 2 or PCI DSS
Both application and human access are in-scope. Since application activity can be logged directly within the app, I’ll focus on human access: how to create an audit trail of activity for staff, consultants, and vendors.
In an ideal world, no one would access the database, and all changes would run through a deployment pipeline and be under version control. But that’s never been the case on any team I’ve been a part of. Just finding what went wrong in the code meant connecting to the PostgreSQL database to investigate.
How to log queries in PostgreSQL
I’ve tried 3 methods to track human activities:
- local PostgreSQL logs
- open-source proxy
- StrongDM 🤩
Each has its pros and cons in terms of ease of setup, performance impact, and risk of exploitation. These are not dependent on users' operating systems (Unix, Windows).
Local logging approach
Native PostgreSQL logs are configurable, allowing you to set the logging level differently by role (users are roles) by setting the log_statement parameter to mod, ddl or all to capture SQL statements.
Alter role "TestUser" set log_statement="all"
After the command above you get those logs in Postgres’ main log file. For example, here’s a log entry for a table creation:
2019-05-05 00:17:52.263 UTC [3653] TestUser@testDB LOG: statement: CREATE TABLE public."TestTable"(id bigint NOT NULL,entry text,PRIMARY KEY (id))WITH (OIDS = FALSE);ALTER TABLE public."TestTable"OWNER to "TestUser"; This is the first step to creating an audit trail of PostgreSQL logs. Postgres can also output logs to any log destination in CSV by modifying the configuration file -- use the directives log_destination = 'csvfile' and logging_collector = 'on', and set the pg_log directory accordingly in the Postgres config file. (The postgresql.conf file is generally located somewhere in /etc but varies by operating system.) This permits easier parsing, integration, and analysis with Logstash and Elasticsearch with a naming convention for log_filename like postgresql-%y-%m-%d_%h%m%s.log. Once you've made these changes to the config file, don't forget to restart the PostgreSQL service using pg_ctl or your system's daemon management command like systemctl or service.
Improving this approach
For some complex queries, this raw approach may get limited results. Bringing PgAudit in helps to get more details on the actions taken by the operating system and SQL statements. As a crude example let's create 10 tables with a loop like this:
DO $$BEGINFOR index IN 1..10 LOOPEXECUTE 'CREATE TABLE test' || index || ' (id INT)';ENDLOOP;END $$;With the standard logging system, this is what is logged:
2019-05-20 21:44:51.597 UTC [2083] TestUser@testDB LOG: statement: DO $$BEGINFORindexIN 1..10 LOOPEXECUTE 'CREATE TABLE test' || index || ' (id INT)';ENDLOOP;END $$;And with PgAudit enabled:
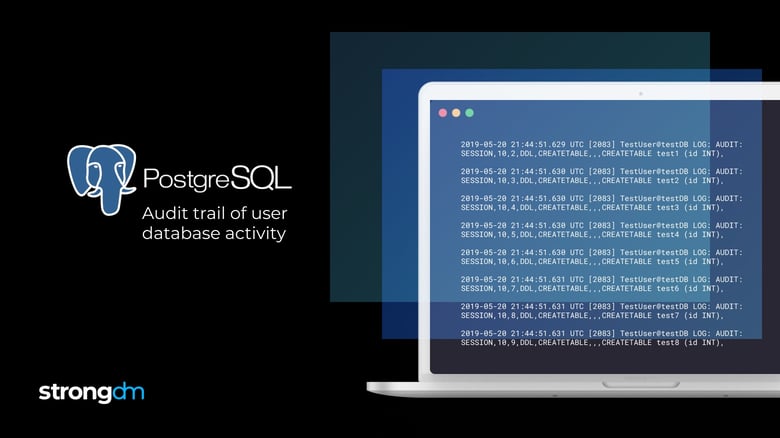
2019-05-20 21:44:51.597 UTC [2083] TestUser@testDB LOG: AUDIT: SESSION,10,1,FUNCTION,DO,,,"DO $$BEGINFOR index IN 1..10 LOOPEXECUTE 'CREATE TABLE test' || index || ' (id INT)';END LOOP;END $$;",<not logged=""></not>2019-05-20 21:44:51.629 UTC [2083] TestUser@testDB LOG: AUDIT: SESSION,10,2,DDL,CREATETABLE,,,CREATETABLE test1 (id INT),<not logged=""></not>2019-05-20 21:44:51.630 UTC [2083] TestUser@testDB LOG: AUDIT: SESSION,10,3,DDL,CREATETABLE,,,CREATETABLE test2 (id INT),<not logged=""></not>2019-05-20 21:44:51.630 UTC [2083] TestUser@testDB LOG: AUDIT: SESSION,10,4,DDL,CREATETABLE,,,CREATETABLE test3 (id INT),<not logged=""></not>2019-05-20 21:44:51.630 UTC [2083] TestUser@testDB LOG: AUDIT: SESSION,10,5,DDL,CREATETABLE,,,CREATETABLE test4 (id INT),<not logged=""></not>2019-05-20 21:44:51.630 UTC [2083] TestUser@testDB LOG: AUDIT: SESSION,10,6,DDL,CREATETABLE,,,CREATETABLE test5 (id INT),<not logged=""></not>2019-05-20 21:44:51.631 UTC [2083] TestUser@testDB LOG: AUDIT: SESSION,10,7,DDL,CREATETABLE,,,CREATETABLE test6 (id INT),<not logged=""></not>2019-05-20 21:44:51.631 UTC [2083] TestUser@testDB LOG: AUDIT: SESSION,10,8,DDL,CREATETABLE,,,CREATETABLE test7 (id INT),<not logged=""></not>2019-05-20 21:44:51.631 UTC [2083] TestUser@testDB LOG: AUDIT: SESSION,10,9,DDL,CREATETABLE,,,CREATETABLE test8 (id INT),<not logged=""></not>2019-05-20 21:44:51.631 UTC [2083] TestUser@testDB LOG: AUDIT: SESSION,10,10,DDL,CREATETABLE,,,CREATETABLE test9 (id INT),<not logged=""></not>2019-05-20 21:44:51.632 UTC [2083] TestUser@testDB LOG: AUDIT: SESSION,10,11,DDL,CREATETABLE,,,CREATETABLE test10 (id INT),<not logged=""> </not>The log output is obviously easier to parse as it also logs one line per execution, but keep in mind this has a cost in terms of disk size and, more importantly, disk I/O, which can quickly cause noticeable performance degradation even if you take into account the log_rotation_size and log_rotation_age directives in the config file.
Open-source Proxy logging approach
There are multiple proxies for PostgreSQL which can offload the logging from the database. Postgres' documentation has a page dedicated to replication. The most popular option is pg-pool II. I won't go into the details of setting it up as their wiki is pretty exhaustive.
The main advantage of using a proxy is moving the IO for logging out of the DB system. The downside is that it precludes getting pgAudit level log output. In order to get the results of the ddl statements it needs to log within the database server.
If your team rarely executes the kind of dynamic queries made above, then this option may be ideal for you. If you don’t mind some manual investigation, you can search for the start of the action you’re looking into.
🕵 Learn how Coveo gained complete visibility across their entire stack with centralized and granular audit logs and simplified compliance audits.
Hey, you talked about the pros and cons; where are they?
Now that I’ve given a quick introduction to these two methods, here are my thoughts:
The main metric impacting DB performance will be IO consumption, and the most interesting things you want to capture are the log details: who, what, and when.
Obviously, you’ll get more details with pgAudit on the DB server at the cost of more IO and the need to centralize the Postgres log yourself if you have more than one node.
The open-source proxy approach gets rid of the IO problem. Since its sole role is to forward the queries and send back the result, it can more easily handle the IO need to write a lot of files, but you’ll lose a little in query details in your Postgres log. On the other hand, you can log at all times without fear of slowing down the database on a high load.
For specific operations, like bug patching or external auditor access, turning on a more detailed logging system is always a good idea, so keep the option open.
As is often the case with open source software, the raw functionality is available if you have the time and expertise to dedicate to getting it running to your specifications. Configuring Postgres for SSPI or GSSAPI can be tricky, and when you add pg-pool II into the mix, the complexity increases even more.
Why StrongDM brings more
If you’re short on time and can afford to buy vs. build, StrongDM provides a control plane to manage access to every server and database type, including PostgreSQL.
StrongDM logs include:
- permission changes
- queries by user
- ssh commands by user
- RDP commands by user
- kubectl commands by user
For example, to audit permissions across every database & server, execute:
sam$ sdm audit permissions --at 2019-03-02Permission ID,User ID,User Name,Datasource ID,Datasource Name,Role Name,Granted At,Expires At350396,3267,Britt Cray,2609,prod01 sudo,SRE,2019-02-22 18:24:44.187585 +0000 UTC,permanent,{},[],0344430,5045,Josh Smith,2609,prod01 sudo,Customer Support,2019-02-15 16:06:24.944571 +0000 UTC,permanent,{},[],0344429,5045,Josh Smith,3126,RDP prod server,Customer Support,2019-02-15 16:06:24.943511 +0000 UTC,permanent,{},[],0344428,5045,Josh Smith,2524,prod02,Customer Support,2019-02-15 16:06:24.942472 +0000 UTC,permanent,{},[],0UTC,permanent,{},[],0270220,3270,Phil Capra,2609,prod01 sudo,Business Intelligence,2018-12-05 21:20:22.489147 +0000 UTC,permanent,{},[],0270228,3270,Phil Capra,2610,webserver,Business Intelligence,2018-12-05 21:20:26.260083 +0000 UTC,permanent,{},[],0272354,3270,Phil Capra,3126,RDP prod server,Business Intelligence,2018-12-10 20:16:40.387536 +0000 UTC,permanent,{},[],0To audit queries across every database type, execute the following:
$ sdm audit queries --from 2019-05-04 --to 2019-05-05Time,Datasource ID,Datasource Name,User ID,User Name,Duration (ms),Record Count,Query,Hash2019-05-04 00:03:48.794273 +0000 UTC,6023,Marketing DB RW,3265,Justin McCarthy,3,1,"SELECT rel.relname, rel.relkind, rel.reltuples, coalesce(rel.relpages,0) + coalesce(toast.relpages,0) AS num_total_pages, SUM(ind.relpages) AS index_pages, pg_roles.rolname AS owner FROM pg_class rel left join pg_class toast on (toast.oid = rel.reltoastrelid) left join pg_index on (indrelid=rel.oid) left join pg_class ind on (ind.oid = indexrelid) join pg_namespace on (rel.relnamespace =pg_namespace.oid ) left join pg_roles on ( rel.relowner = pg_roles.oid ) WHERE rel.relkind IN ('r','v','m','f','p') AND nspname = 'public'GROUP BY rel.relname, rel.relkind, rel.reltuples, coalesce(rel.relpages,0) + coalesce(toast.relpages,0), pg_roles.rolname;\n",8b62e88535286055252d080712a781afc1f2d53c2019-05-04 00:03:48.495869 +0000 UTC,6023,Marketing DB RW,3265,Justin McCarthy,1,6,"SELECT oid, nspname, nspname = ANY (current_schemas(true)) AS is_on_search_path, oid = pg_my_temp_schema() AS is_my_temp_schema, pg_is_other_temp_schema(oid) AS is_other_temp_schema FROM pg_namespace",e2e88ed63a43677ee031d1e0a0ecb768ccdd92a12019-05-04 00:03:48.496869 +0000 UTC,6023,Marketing DB RW,3265,Justin McCarthy,0,6,"SELECT oid, nspname, nspname = ANY (current_schemas(true)) AS is_on_search_path, oid = pg_my_temp_schema() AS is_my_temp_schema, pg_is_other_temp_schema(oid) AS is_other_temp_schema FROM pg_namespace",e2e88ed63a43677ee031d1e0a0ecb768ccdd92a12019-05-04 00:03:48.296372 +0000 UTC,6023,Marketing DB RW,3265,Justin McCarthy,0,1,SELECT VERSION(),bfdacb2e17fbd4ec7a8d1dc6d6d9da37926a11982019-05-04 00:03:48.295372 +0000 UTC,6023,Marketing DB RW,3265,Justin McCarthy,1,253,SHOW ALL,1ac37f50840217029812c9d0b779baf64e85261f2019-05-04 00:03:58.715552 +0000 UTC,6023,Marketing DB RW,3265,Justin McCarthy,0,5,select * from customers,b7d5e8850da76f5df1edd4babac15df6e1d3c3beTo export logs, execute the following:
sdm audit queries --from 2019-05-21 --to 2019-05-22 --json -o queries
In addition to logs, StrongDM simplifies access management by binding authentication to your SSO. To onboard or offboard staff, create or suspend a user in your SSO, and you’re done. No more credentials or SSH keys to manage.
StrongDM provides detailed and comprehensive logging, easy log export to your log aggregator or SIEM, and one-click provisioning and deprovisioning with no additional load on your databases.
To start logging PostgreSQL queries today, sign up for a free, 14-day trial.
Next Steps
StrongDM unifies access management across databases, servers, clusters, and more—for IT, security, and DevOps teams.
- Learn how StrongDM works
- Book a personalized demo
- Start your free StrongDM trial

Categories:
You May Also Like


