
StrongDM’s Next-Gen Kubernetes provides secure, seamless access to Kubernetes clusters at scale. By eliminating standing privileges and enforcing Zero Trust security principles, StrongDM helps security teams maintain tight access controls without slowing down DevOps workflows.

Contents
Secure Access Made Simple
- Full Access to All Features
- Trusted by the Fortune 100, early startups, and everyone in between
Observability and monitoring are often used interchangeably, but there are key differences you should know between these two IT terms and the tools that enable them. In this article, we’ll explore the relationship and differences between observability vs. monitoring. Plus, you’ll learn about what makes observability and monitoring different from telemetry and application performance monitoring (APM). By the end of this article, you’ll feel more confident choosing the right observability and monitoring tools to support your organization’s IT strategy.
Observability vs. Monitoring: What’s the Difference?
The difference between observability and monitoring focuses on whether data pulled from an IT system is predetermined or not. Monitoring is a solution that collects and analyzes predetermined data pulled from individual systems. Observability is a solution that aggregates all data produced by all IT systems.
Most monitoring tools use dashboards to show performance metrics and usage, which IT teams use to identify or troubleshoot IT issues. However, since those dashboards are created by your team, they only reveal performance issues or abnormalities your team can anticipate. That makes it difficult to monitor complex cloud-native applications and cloud environments for security and performance issues, where the security issues teams encounter are often multi-faceted and unpredictable.
By contrast, observability software uses logs, traces, and metrics collected across your entire IT infrastructure to proactively notify IT teams of potential issues and help them debug their systems. While monitoring simply displays data, IT teams can use observability infrastructure to measure all the inputs and outputs across multiple applications, microservices, programs, servers, and databases. By understanding the relationships between IT systems, observability offers actionable insights into the health of your system and detects bugs or vulnerable attack vectors at the first sign of abnormal performance.
Observability also plays a critical role in your overarching IT infrastructure. As a critical element of the Zero Trust security model, observability offers the insight into user behavior and usage that’s necessary to protect your systems from unauthorized access. Consistent logging provides insight into any abnormalities within your system, not just those related to health or performance.
💡Deeper Dive: Not all logging and monitoring is created equal. Use StrongDM’s 11 log management best practices to learn to effectively log critical events that happen in your infrastructure, including who did what, when, and where.
What are Observability and Monitoring?
Observability and monitoring are often referenced simultaneously in conversations about IT software development and operations (DevOps) strategies. While both play a key part in keeping your systems, data, and security perimeter safe, observability and monitoring are complementary capabilities and are not the same thing. Before we start exploring the differences, we must define each term to fully grasp how observability and monitoring support your IT goals and needs.
Observability
We define observability as the ability to assess an internal system’s state based on the data it produces. An observability platform helps IT operations teams observe—or gain deeper insight into—the health and status of different applications and resources across your IT infrastructure simultaneously. By garnering insights from each system’s data, IT teams can proactively detect abnormalities, analyze issues, and resolve problems.
Observability tools use algorithms based on the mathematical control theory to understand the relationships between systems across your company’s multi-layered IT infrastructure, including cloud environments, on-premises software, and third-party applications. These tools then monitor the health and status of your systems using logs, metrics, and traces—known as the three pillars of observability. When the tool detects an abnormality, it notifies the team and provides the data they need to quickly troubleshoot and solve the issue.
Monitoring
Observability wouldn’t be possible without monitoring. Generally, monitoring is defined as the collection and analysis of data pulled from IT systems. DevOps monitoring uses dashboards— often developed by your internal team—to measure the health of your applications by tracking particular metrics.
By giving you information about your application’s usage patterns, monitoring helps IT teams detect and solve issues. However, for monitoring to work, you have to know which metrics to track. That means data you aren’t tracking could expose issues, but those issues continue to fly under the radar. This illustrates the primary difference between monitoring vs. observability.
A Brief History of Monitoring and Observability
While monitoring as an IT concept has existed since the advent of the internet, there were no consistent standards for monitoring IT systems until the creation of Simple Network Management Protocol (SNMP) in 1988. SNMP manages collecting and organizing data within an IP network at 5- or 15-minute intervals, and it continues to provide a foundation for many DevOps performance monitoring tools and processes. Now, however, many modern monitoring tools rely on OpenConfig and gNMI protocols—founded in the 2000s—to gain real-time monitoring capabilities for critical DevOps measurements.
Monitoring has supported businesses for the last two decades, but in the mid-2010s, companies discovered they needed more extensive visibility and monitoring capabilities across their expanding IT infrastructures. While the foundation of observability started with the discovery of control theory in 1960, observability in IT originated when companies like Twitter and Stripe started exploring ways to enable wider-reaching application and cloud observability capabilities. Since observability metrics go far beyond the capabilities of most monitoring tools, many companies are introducing observability architecture or observability-as-a-service into their cybersecurity and data management strategies.
The Relationship Between Observability and Monitoring
DevOps’ foundations are monitoring and observability. At its core, monitoring makes observability possible. When DevOps is monitoring applications, they’re often reviewing multiple metrics simultaneously to determine the health and performance of each application. Collecting and displaying the data from different IT systems is essential to program monitoring in DevOps because it shows when a system or application is experiencing an issue. But, without observability, it’s difficult for teams to discover the root cause of the performance issue.
Observability and monitoring tools work together to offer robust insight into the health of your IT infrastructure. While monitoring alerts the team to a potential issue, observability helps the team detect and solve the root cause of the issue. Even when a particular endpoint isn’t observable, monitoring its performance still plays a vital role—it adds more information to help triage and diagnose any concerns within the system as a whole.
Similarly, visibility contributes to the overall relationship between observability and monitoring. Visibility into an isolated system makes observability into potential issues possible, but only into one element of your IT infrastructure. The key difference between observability vs. visibility is scope—observability offers perspective across multiple tools and applications, while visibility focuses on just one. However, when visibility is combined with monitoring, it can offer a solution to detect both expected and unexpected performance issues for endpoints or systems that aren’t observable within your IT infrastructure.
Observability vs. Telemetry vs. APM vs. Visibility
Tracking the health of applications is critical in DevOps, and observability, telemetry, and application performance management (APM) all make that possible. However, they each support IT teams to varying degrees. Here’s how each of these terms differ from one another.
Observability vs. Telemetry
Telemetry is the ability to collect data—including logs, metrics, and traces—across disparate systems, especially in dynamic cloud environments or across cloud-native applications. Essentially, telemetry is a more advanced monitoring tool that can be used across your entire IT architecture.
While telemetry tools offer robust data collection and standardization, they still can’t provide the deep insight DevOps teams need to quickly debug their systems and find the root cause of issues. Observability in DevOps calls for the ability to understand why an issue is occurring through analysis and insights, which underlies the main difference between observability vs. telemetry.
Observability vs. APM
Observability and APM seem very similar at first glance. They both offer substantial insight into end-to-end performance and security for applications. However, the key difference between observability vs. APM lies in the depth of insight necessary for a particular team.
Both APM and observability use telemetry to collect data across disparate systems. But, while APM offers a more high-level method of tracking system health and end-to-end monitoring of an application’s transactions, observability dives deep into the technical details that developers need for root cause analysis.
In DevOps, performance monitoring is extremely important. Application observability takes performance monitoring a step further by providing the “why” behind a performance issue.
Observability vs. Visibility
Visibility offers a high-level, comprehensive view of data from networks, systems, applications, and so forth. Monitoring tools collect and aggregate this data, rendering a big-picture view of the “what” in an IT environment, including:
- Network traffic
- Servers and endpoints
- Bandwidth usage
- Logs and event data
- Configuration changes
This also includes the ability to track what users are doing — the files they access, the applications they use, and their login history.
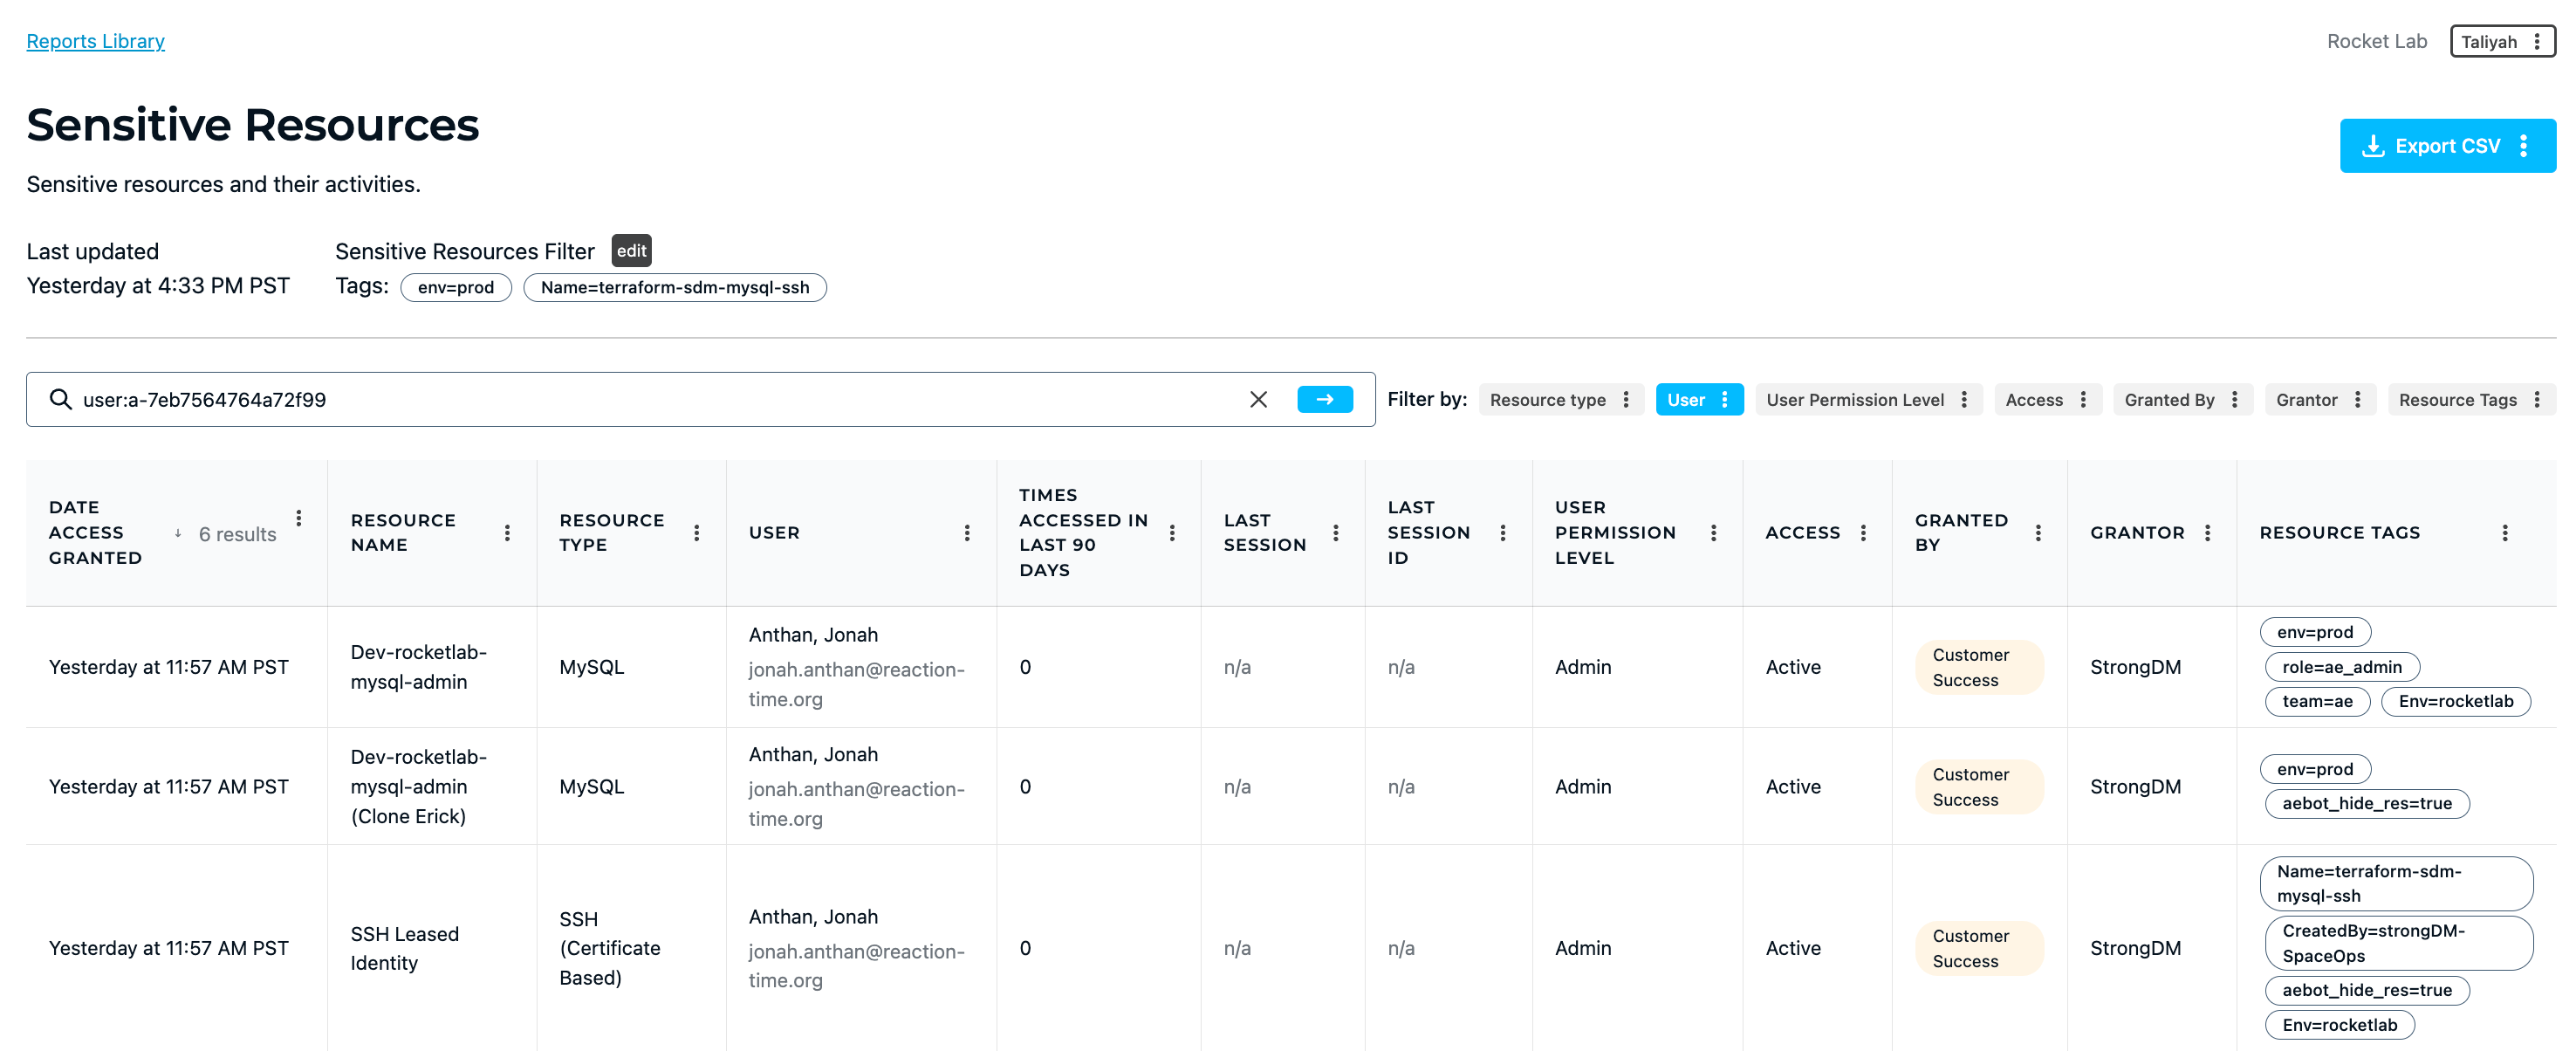
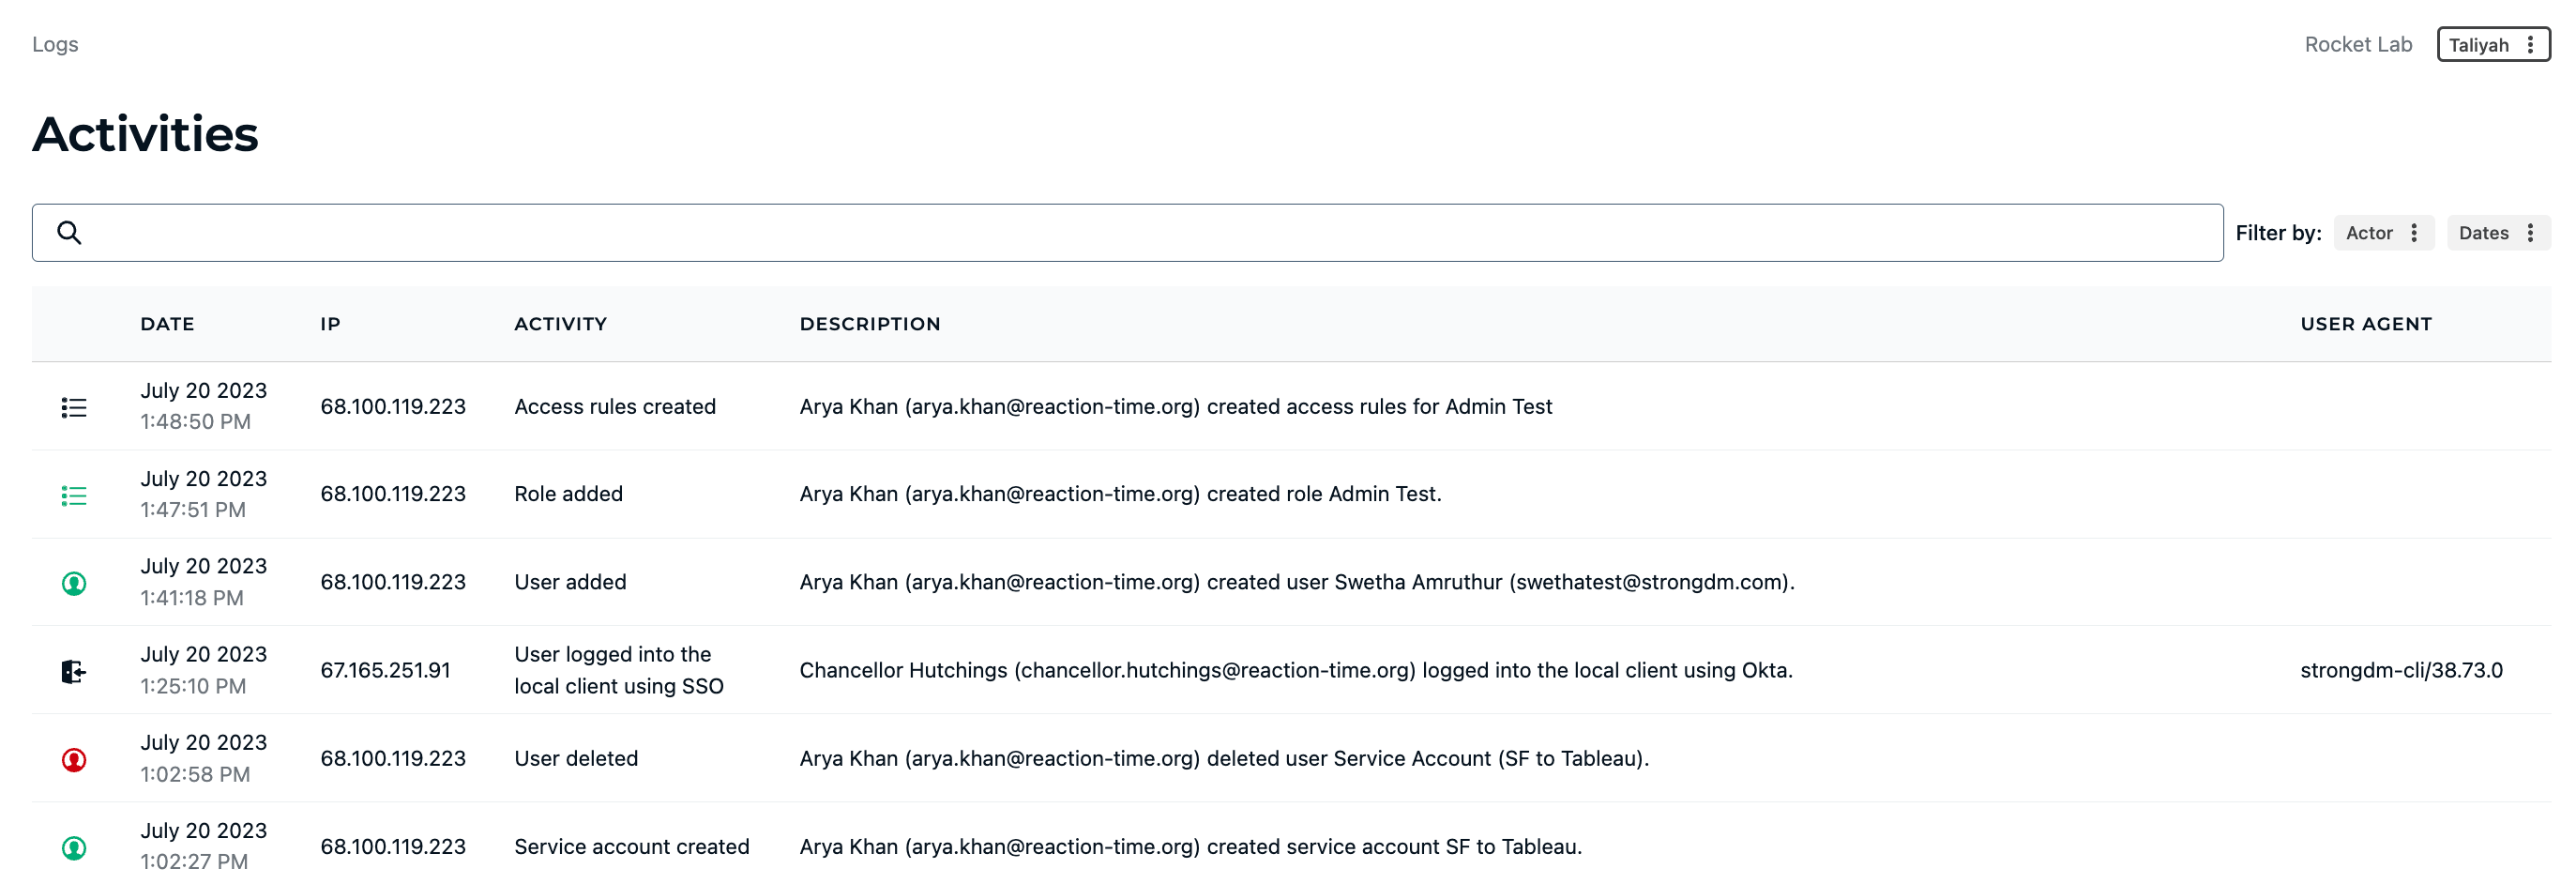
💡Make it easy: Easily see who is accessing which of your most critical resources at all times with StrongDM reporting. Understand activity history, methods of access, user permissions and more so you can easily determine when and where to lock down your applications.
Observability, on the other hand, provides a detailed, granular view of what events occur in an IT environment and also why. Leveraging tracing, logs, and metrics, observability allows deep, targeted exploration of raw IT data. It enables custom troubleshooting, following the data trail from the end-user experience all the way to the root cause.
Monitoring vs. Telemetry vs. APM
Compared to observability, monitoring is much more similar to telemetry and APM. While both telemetry and APM are advanced types of monitoring, they can support availability monitoring in DevOps and offer unique insight into the health and performance of IT systems. Here’s how each of these terms differ from one another.
Monitoring vs. Telemetry
Telemetry makes monitoring possible across remote or disparate parts of your IT infrastructure. While many monitoring tools aren’t equipped to support cloud-native environments, telemetry offers more robust monitoring capabilities across all tools and applications. This can help developers detect security issues or bugs that regular monitoring wouldn’t have caught.
Additionally, while traditional monitoring tools can only track specific metrics defined by developers, telemetry can help developers track the overall health of certain systems.
Monitoring vs. APM
APM is a type of monitoring designed specifically for tracking end-to-end transactions within particular applications. APM combines monitoring with telemetry data to enhance the user experience, perform availability monitoring in DevOps, and improve performance.
When comparing observability vs. APM vs. monitoring, we’re discussing the scope of monitoring available across different tools to detect system bugs. While APM is a type of monitoring that can support and strengthen application performance, it remains limited to applications. Observability offers metrics and insight into the health and performance of the entire IT infrastructure, not just applications.
Observability and Monitoring: Which One Is Better?
In DevOps, observability and monitoring go hand in hand. However, when you’re choosing the right tools to support your team, you may feel you have to choose between monitoring tools and an observability platform.
Observability is essential for developers to effectively perform root cause analysis and debug their systems. With observability software, developers can do this work more easily than if they relied solely on monitoring tools, including telemetry and APM tools. But, in a modern IT environment, all these tools can work together to support different IT teams and offer substantial insight into the health, performance, and availability of various systems, servers, environments, and applications across your IT infrastructure.
For many DevOps teams, observability tools may be better for you than monitoring tools to quickly detect, troubleshoot, and solve issues.
How to Choose the Right Tool for Observability and Monitoring
The best tools for observability provide the end-to-end visibility, monitoring, and telemetry data needed across a dispersed IT infrastructure. For many organizations, that includes cloud-native applications and cloud environments. Observability and monitoring in AWS, for example, are essential for many businesses, but there are many tools that can’t manage the complexity necessary to provide the observability needed within a cloud environment.
Datadog is a powerful observability and monitoring tool that provides seamless visibility and logging across the entire DevOps stack, including cloud environments. For organizations managing a small to mid-sized IT tech stack, Datadog supports robust monitoring capabilities. However, for larger organizations, observability with Datadog may be limited depending on the number of containers and microservices you need to monitor.
Meanwhile, popular tools like Splunk offer top-notch telemetry for large organizations. Observability in Splunk is powered by comprehensive logging, full-fidelity tracing, and real-time streaming analytics. It can also support security initiatives by providing usage and access management.
To support your data observability tool, StrongDM offers expanded visibility into user activities and access. This Zero Trust Privileged Access Management (PAM) Platform provides exceptional monitoring and visibility capabilities into how users are accessing and using your data. While observability tools offer tunnel vision of the objects in your tech stack, ZeroTrust PAM expands the scope to the people in your tech stack — which is where cybersecurity issues begin and end.
When searching for the right observability tool, always start by confirming that the tool provides logs, metrics, and traces. From there, look for storage that offers long retention periods and fast retrieval for auditing. Finally, make sure your tool is easy to use, including supporting visuals, so your team can quickly review and troubleshoot issues.
💡Pro tip: Tools like StrongDM give you visibility into every person who had accessed (or attempted to access) your stack. Security and Compliance teams can easily answer who did what, where, and when.
Using Observability and Monitoring to Improve Your Company’s Security Posture
When it comes to observability vs. monitoring, each component plays an important but slightly different role in your DevOps strategy. However, both are crucial to defending your company’s security perimeter against unauthorized users.
While observability and monitoring are often used to track health and performance, they also contribute to keeping your IT systems safe. Gaining observability across your IT infrastructure ensures that issues are addressed quickly, eliminating exploitable vectors from your attack surface. Plus, logging can offer deeper insight into usage across your tech stack, providing early warning of anomalies and unauthorized access.
Improve Access Management
Protecting and reducing your attack surface becomes even more valuable when you control who has access to which applications. StrongDM’s Dynamic Access Management Platform streamlines monitoring by limiting which users can access each element of your IT infrastructure — and allowing you to track their activities across systems.
Improve MTTI and MTTR
Should the inevitable cyber incident occur, observability and monitoring can positively affect your mean-time-to-investigate (MTTI) and mean-time-to-recovery (MTTR). StrongDM automates incident response workflows and gives appropriate members of your team access to resources. Integrated with an incident management tool like PagerDuty also allows you to automate the process of access, granting it upon alert of an incident and immediately revoking it when the investigation is over.
Improve Planning and Documentation
Add SIEM, SOAR, or SIRP tools to the mix to execute proper incident planning, documentation, and coordination among relevant teams — ultimately addressing and resolving the incident as quickly and succinctly as possible.
By combining the Infrastructure Access Platform with your observability and monitoring tools, you can develop a Zero Trust security model you can count on. Sign up for our free, no-BS demo today to learn how.
Categories:
You May Also Like
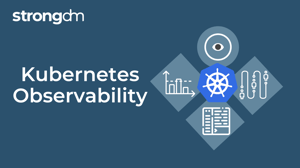
Kubernetes observability is the practice of monitoring and analyzing a Kubernetes environment through metrics, logs, and traces to gain visibility into system performance and health. It enables teams to detect and resolve issues proactively, optimize resource utilization, and maintain cluster reliability through real-time insights and automated monitoring tools.
Audit logging is essential for maintaining a secure and compliant IT infrastructure. By capturing detailed records of system activities, audit logs provide insights into user actions, system events, and potential security threats. Understanding audit logging helps you identify and address vulnerabilities, ensure regulatory compliance, and enhance overall system integrity.

In this article, we will spotlight 11 log management best practices you should know to build efficient logging and monitoring programs. You’ll learn how to establish policies and take a proactive approach to collecting, analyzing, and storing business-critical log data. By the end of this article, you’ll have a clearer understanding of how logs can help security teams detect suspicious activity, address system performance issues, identify trends and opportunities, improve regulatory compliance, and mitigate cyberattacks.
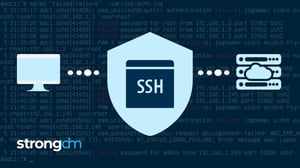
Two of the most important questions in security are: who accessed what, and when did they access it? If you have any Linux or Unix machines, you’ll likely find answers in the sshd log. sshd is the Secure Shell Daemon, which allows remote access to the system. In this article, we’ll look at how to view ssh logs.