
SOC 2 and ISO 27001 both provide companies with strategic frameworks and standards to measure their security controls and systems against. But what’s the difference between SOC 2 vs. ISO 27001? In this article, we’ll provide an ISO 27001 and SOC 2 comparison, including what they are, what they have in common, which one is right for you, and how you can use these certifications to improve your overall cybersecurity posture.

Contents
Secure Access Made Simple
- Full Access to All Features
- Trusted by the Fortune 100, early startups, and everyone in between
We recently completed our own SOC 2 audit, so we thought we’d review how we dogfooded our own product. We’ll share tips and tricks to make the audit process a little easier, whether you’re wrapping up your own or about to dive into the coming year’s audit. Here are the questions auditors asked us during our own SOC 2 audit and the commands and StrongDM tooling we used to gather the evidence they requested.
Learn to Parse Auditor Questions
First, we have to translate some auditor jargon for you. Below is a list of the questions we were asked and how we interpreted them in simple English.
Part of your task during a SOC 2 audit is resolving questions like “list of infrastructure changes.” In many cases, StrongDM can play a part in helping you do that, especially for the early topics on access controls, Roles, and permissions. Here’s how you can use the StrongDM audit command line interface (CLI) and issue specific commands to get the information you need for your audit.
Use the StrongDM CLI
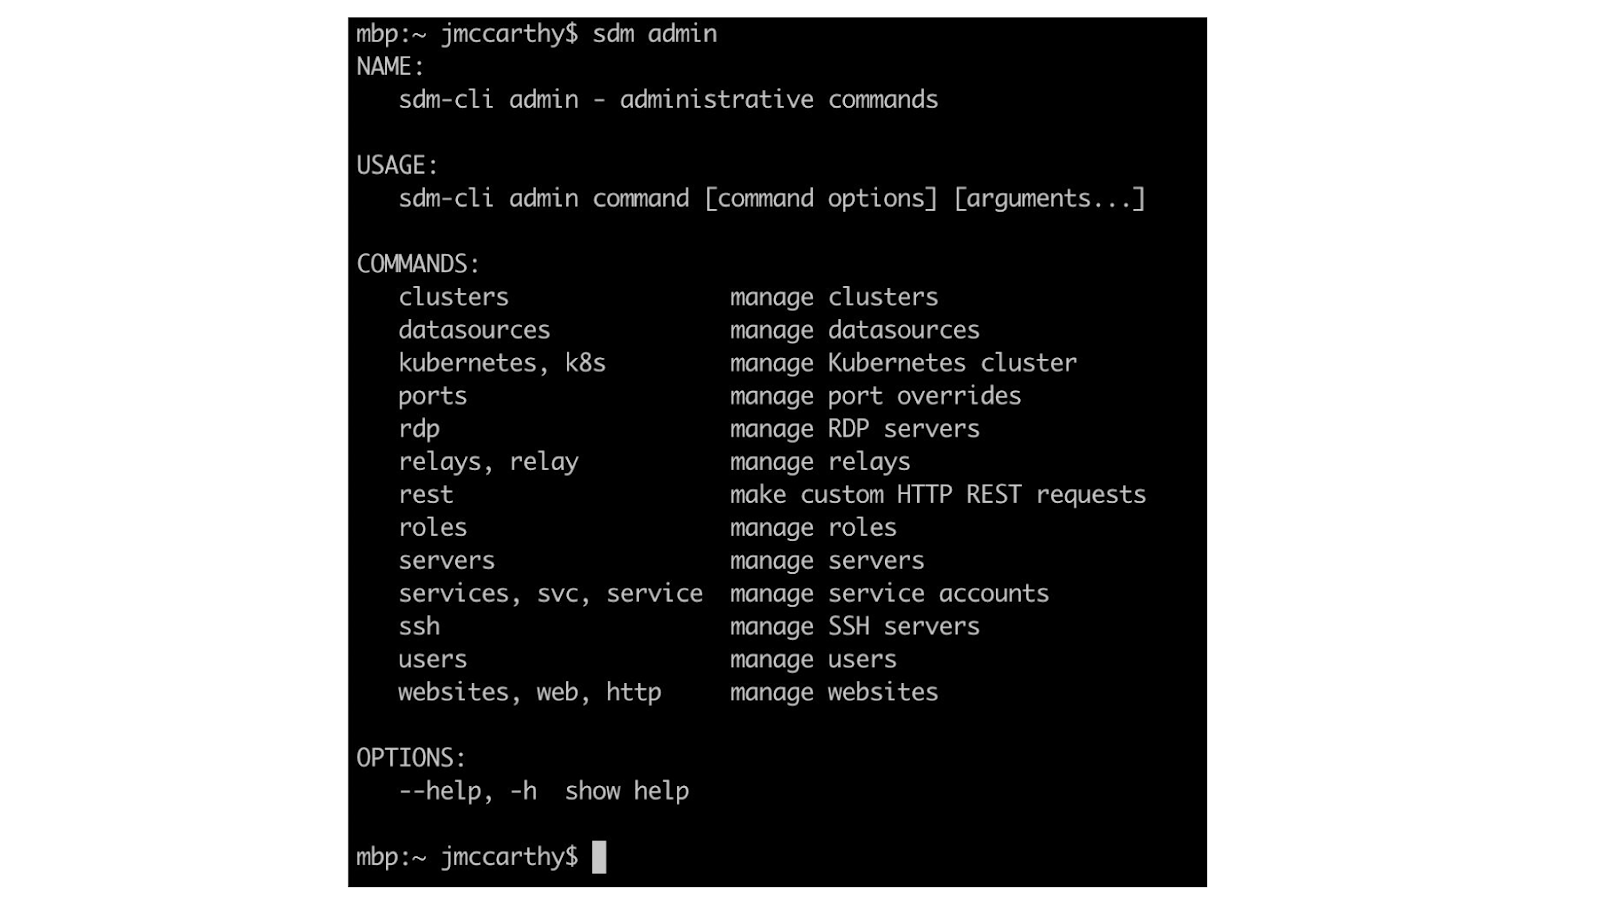
A subcommand within the StrongDM CLI, ‘sdm audit’ provides a historical look back over all the major dimensions of your StrongDM installation. The commands you see in the image of the CLI below have a notion of point in time because behind the scenes, every change in the configuration of your system is preserved.
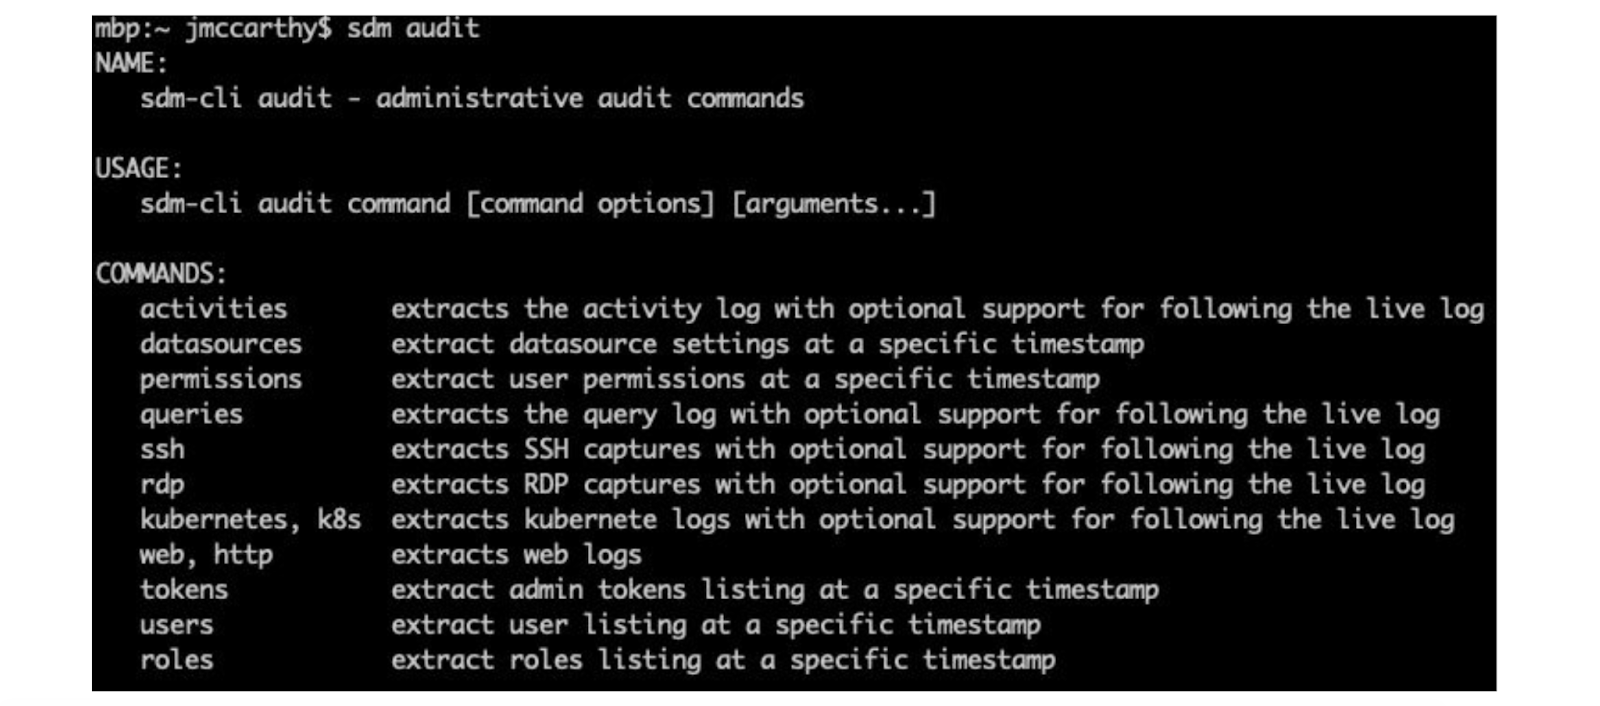
One of this command’s inherent properties is that you can roll back to a point in time and report on how things were in that millisecond. That applies to the configuration of your data sources, the inventory of your users, and the permissions between the users, the Roles, and the targets.
The audit command is also your entry point to getting the extremely high-volume logs, if you do store activity logs that capture the interactions with your target resources. For example, in some databases, it’s queries; in the case of interactive protocols, it’s session replays. So ‘sdm audit’ is also your entry point to getting access to those types of logs.
We’ll also be seeing commands in the ‘sdm admin’ subcommand, which is responsible for more of the CRUD operations on your resources. We’ll use it for its ability to manipulate and list tags, for example. Many of the resources we’ll look at have tags that designate them as part of one product or region, and that’s an important dimension for isolating the scope of your evidence gathering.
Let’s go through each audit question, and look at how we used the StrongDM CLI to gather the requested information. You can follow along with this gist, which lists all the commands and what they do: https://gist.github.com/jmccarthy/d5809f04c2c46f34406b39e56866d69f
Show Infrastructure Changes made during this review period
List infrastructure changes made during this review period. This is a high-level request, and you might have sources in git or in something like Cloudtrail. In the case of StrongDM, we can provide some fraction of response to this.
Approach:
- Start with activities.
- Drill into point-in-time snapshots.
We start by looking through what we refer to as activities, which are major change events in your system, and then we scope that in one way and filter down to the activities that speak to infrastructure changes as you define them. Once we identify a particular activity, we can drill into a point in time to see how the infrastructure was changed.
In our example, we can see all the activities between Jan 1 and March 1, as well as a few extra arguments. You can see the stream of changes and add optional parameters. The default output format is CSV, but you can ask for JSON. (I uses JQ, a Unix command line utility you can use to filter and select from a stream of JSON documents.) Another theme in our subcommands is the extended output. There’s often a default field set that speaks to the most common use cases, and “-e” gives you more fields.
If you look at the stream below, with the JQ but with no filtering, you can see the structure of an activity. There’s a humanized description: In this case, the actor is referred to as “Unknown User” because they no longer list in that demo environment. The IP address that originated that activity is highlighted in the image.
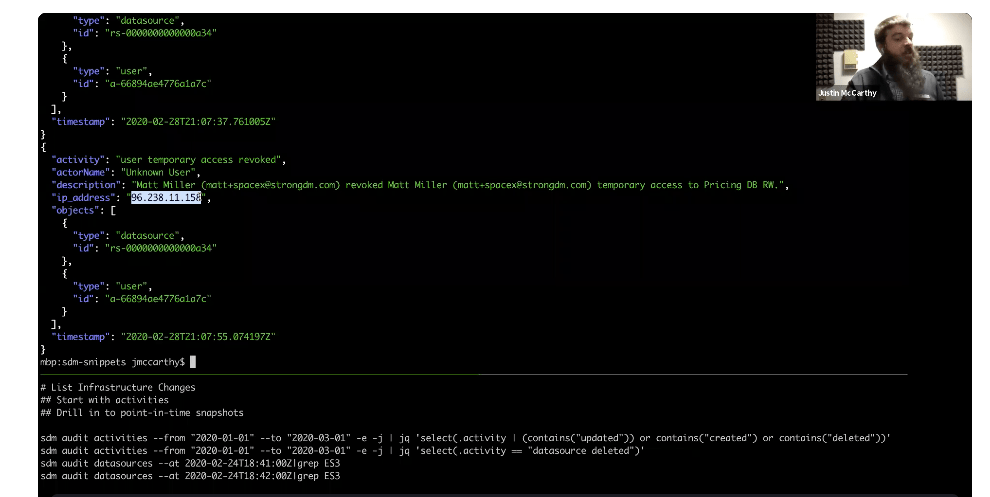
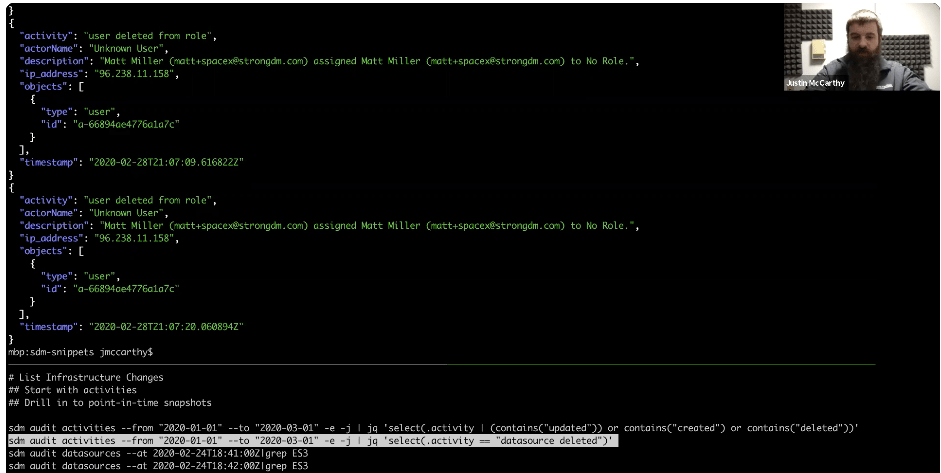
We can rely on the structure of this activity name itself because it comes with predictable patterns that we can use to filter our activity stream. When we reintroduce the full JQ, you can see that anything where the activity contains “updated,” “created,” or “deleted,” filters the activity to show infrastructure changes.
In the example below, we focus down to just the deletion of a registered database or service. There is an instance of a data source that was deleted that was an Elasticsearch cluster, and we can drill into the point in time when that was deleted with additional search queries.
In this case, we’re not asking for the JSON form, we’re asking for the CSV output of the state of all the defined data sources in this one minute in February 2020. Then, we’ll ask for the state one minute later. We can use the activity stream and show the before-and-after of the state of the system. There was an ES3 clone, and then it was gone one minute later, and that corresponds to the delete event. So by extending this pattern, jumping back and forth between activities and audits of the data sources and servers you have defined, you should be able to collect evidence on exactly when a particular system was introduced, updated, or removed.
List Users Who Can Make Changes
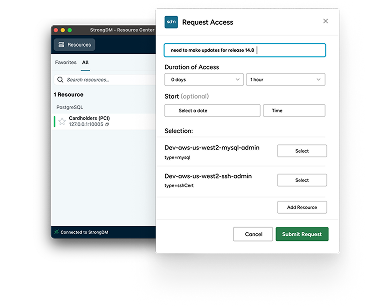
List of users with the ability to promote/implement changes to the production environment (A1). Moving on to something that’s more user-centric, we want to get a list of users with the ability to promote or implement changes to the production environment. In many cases, your single sign-on directory is going to have some role to play here. Assuming there’s some Bastion server or some other kind of StrongDM resource that’s part of promoting or implementing changes in production, we're going to identify those resources and show the corresponding list of users.
Approach:
- Identify resources (servers, etc.).
- Show user list via RBAC.
First, we’ll grab a list of data sources that have the scope in which we’re interested. In this case, we’ve defined a tag that has the value “production.” In this case, we’re using tags to subset the resources to those that are in the scope of the audit.
Once we’ve got that list, the next step is to identify which users might have access to those resources. To do that, we’ll use the “audit permissions” subcommand to show us all the permissions as they exist at any given time, down to the millisecond.
Because of the limitations of this command line filtering, you can imagine a much broader listing where you might want to use a different sort of query system. The essence would be the same. You’re going to use one listing to drive your filtering of another.
Catalog High-Privilege RBAC and Admins
Admin listings with Roles and permissions for in-scope networks (S2)(A2). Let’s talk about Roles and permissions for admins. There are a lot of questions concerned with networks, but in 2021 this is always going to be virtual or a hybrid. You need a way to map a set of Roles to somebody who could theoretically make a change to a network.
There are two dimensions to this: (1) Identify users with access to high-privilege systems, and (2) enumerate StrongDM administrators who can elevate privileges. For questions like this, we tend to respond with both.
Approach:
- Show user list for high-privilege RBAC.
- Show user list of StrongDM admins.
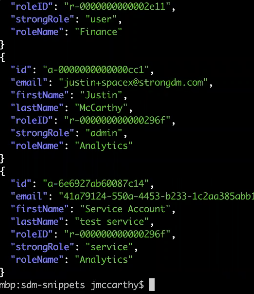
Some clarification—In the CLI image below, you’ll notice there’s a field on the audit users listing called “strongRole,” which refers to whether the user is an administrator or a regular user within the StrongDM deployment. Next to it is “roleName,” which is what you know as Roles within the StrongDM data model.
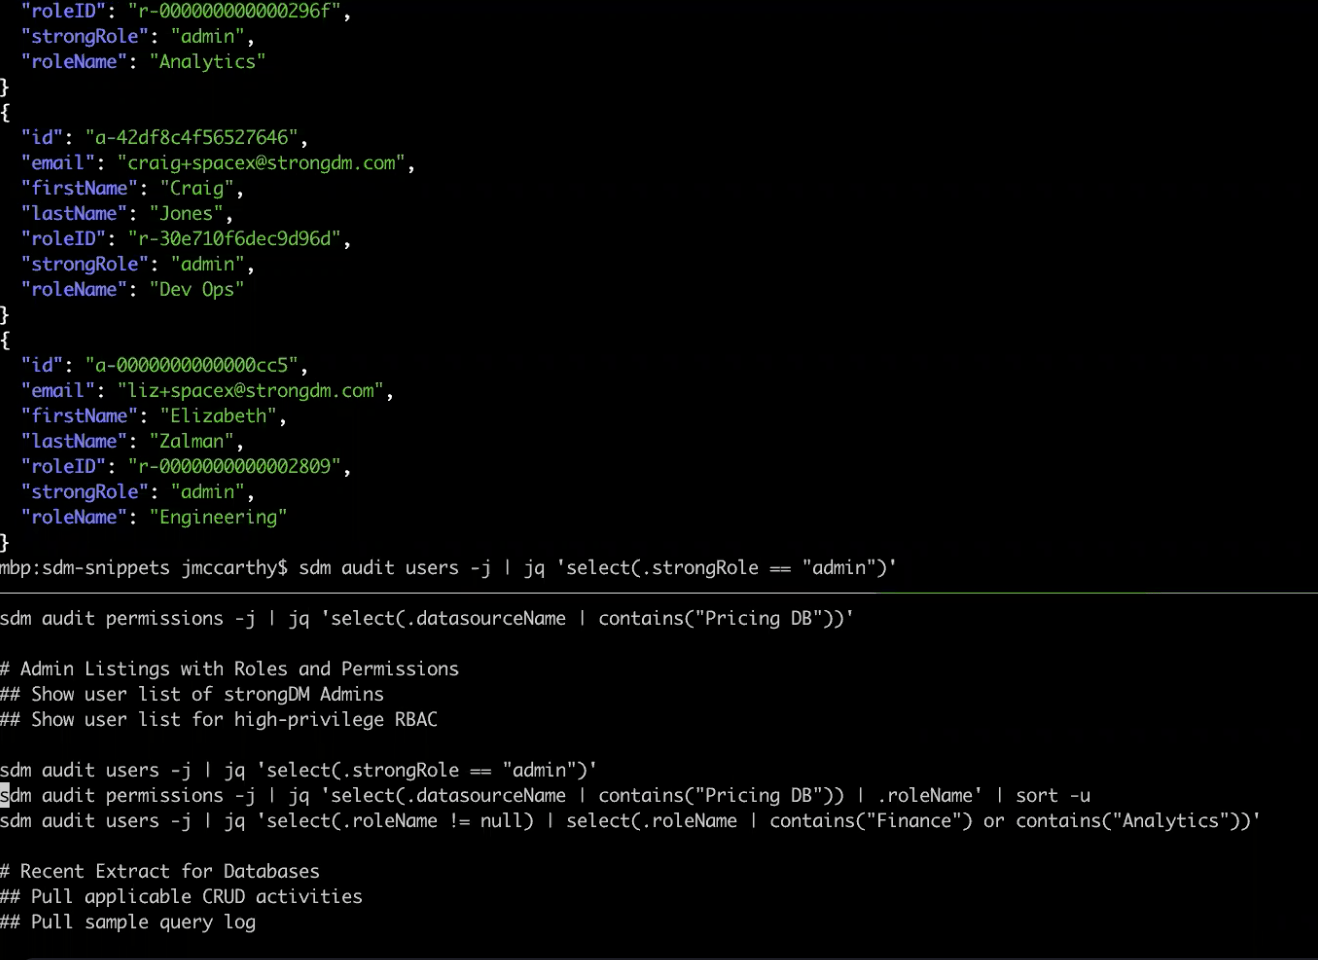
In this case, we’re saying that this pricing DB is a sensitive resource, and we pulling out the list of Roles that have access to that sensitive resource. In this example, there are two Roles that have access to the target system, and the next step is to comment on which users are in those Roles.
You can use the time-rewind functionality to go back to the second day of this year, and you'll notice there’s an entirely different set of Roles that had access to this system, which is pervasive throughout these subcommands. The time dimension is always present as you think about StrongDM and an audit.
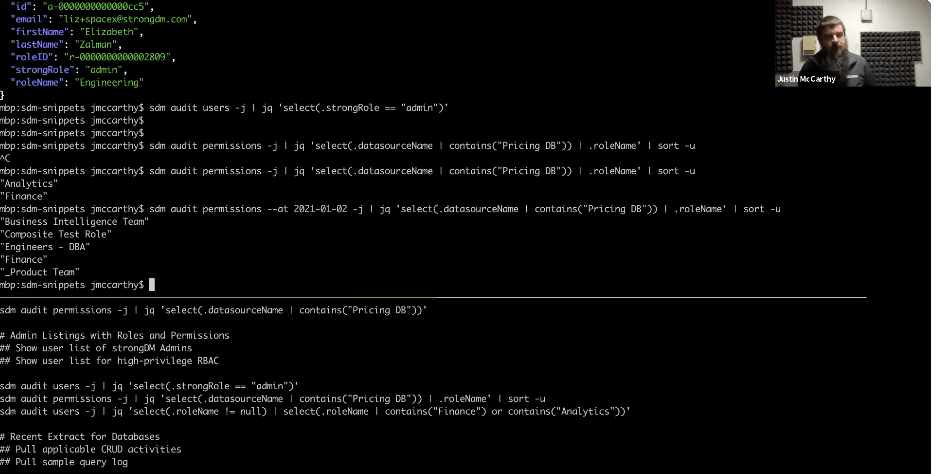
To review, we’ve got this fixed short list of Roles we’re interested in, and then we’re saying, give us a list of users, but only those users in finance or analytics.
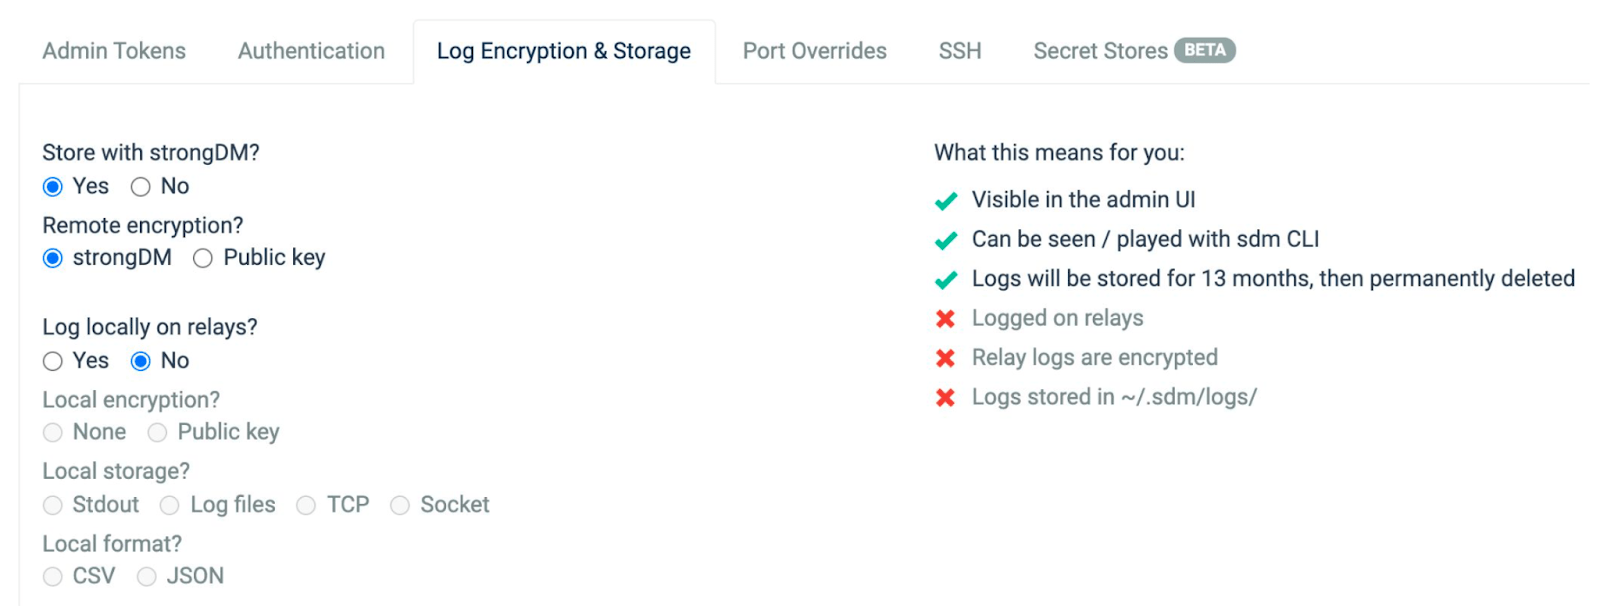
Configure Your Audit Logs
Audit log settings with a recent log extraction for in-scope networks (S2) (A2). This is the section of the StrongDM admin UI that deals with the configuration of your audit logs and humanized explanations. The screenshot below provides a useful opening to a written paragraph explaining the nature of the audit configuration on the StrongDM system. We provided many screenshots of our interface when we submitted our audit.
Approach:
- Refer to settings spreadsheet.
- Pull applicable CRUD activities.
- Pull sampe query log.
In the CLI, the target we’re interested in, “Pricing DB RO,” has an ID listed. If you recall from working with activities earlier, activities have an extended mode, and you can see that for any CRUD that’s happened on those objects, you’ll have references that refer to a type and ID somewhere else in the system. We rely on that linkage to say, “Show us CRUD activities that relate to this database, as long as the ID of a linked object is the ID that we’re targeting.”
You’ll get all the changes with respect to that database.
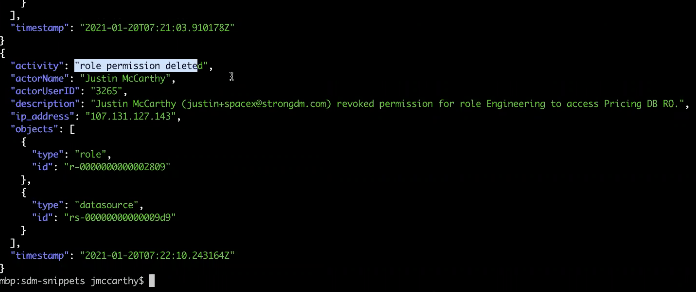
Finally, you’ll be able to show the actual queries that interact with that database using JSON extended and then filtering on “datasourceName.”
Describe Password and Authentication Settings
Password or authentication settings for in scope databases (S2)(A2). A lot of audit questions ask about the details of the authentication process. The password-setting part of the answer will come from your directory or single sign-on, and showing that StrongDM is linked to your single sign-on will be part of that. We also explain in writing that the credentials of the underlying system become the StrongDM and the SSO credentials.
Demonstrate That a DMZ is Established
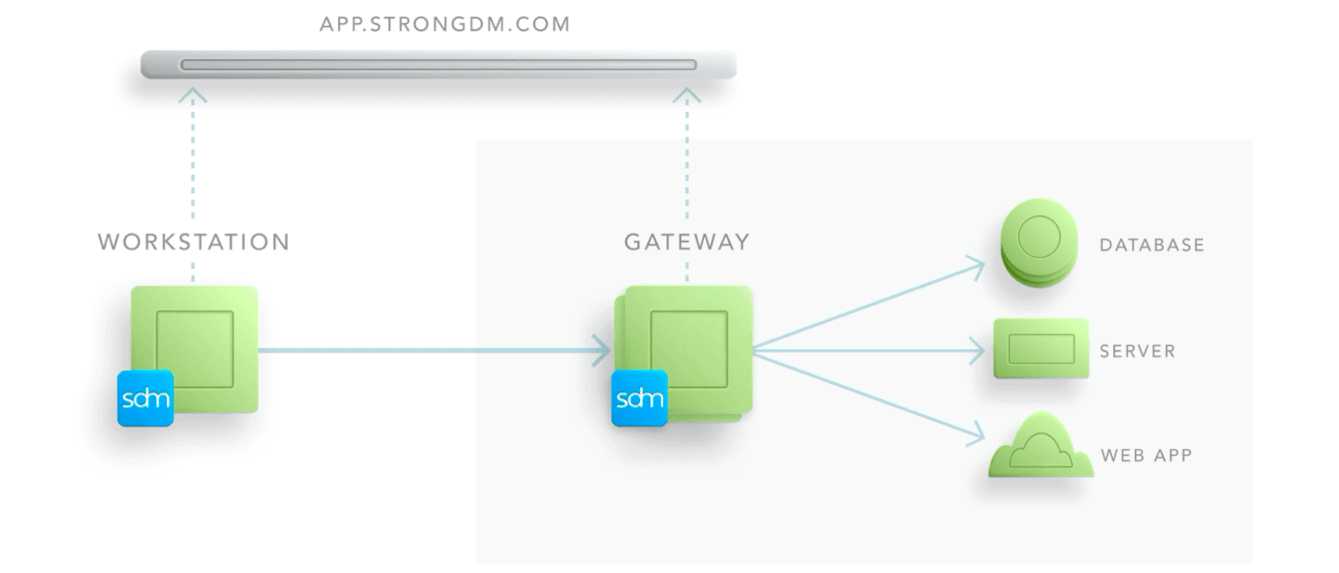
Evidence that a DMZ is established to limit inbound and outbound traffic to only protocols necessary for the covered data environment (A2). This year, we had to explain that there is some separation in terms of how traffic enters and exits our environment. We added some written information to the architecture diagram on the StrongDM website to explain that the inbound access from administrators for these sensitive use cases is governed by the StrongDM gateway.
Q&A
Question: What, if any, automations or runbooks would we recommend to automate evidence collection, going forward?
Answer: Our first recommendation is to think about tagging because inevitably, it will be useful for separating your in-scope systems from your out-of-scope systems at audit time. That’s a relatively new feature that you can't see in our administrative interface, but if you explore the SDM admin subcommands, you’ll see that tagging exists pervasively. Ultimately, tags will exist on every object: users, resources, and one or two more domain objects.
In terms of other automation or runbooks, everything we showed today was done on the command line. For many of our customer environments, a regular automated extract of these JSON records just means going into a system that’s easier to query than with JQ. You have other kinds of log feeds that can emit CSV or JSON, and you can go back in time through the entire retention period. Our main recommendation is to come up with a plan that your team regards as conveniently queryable.
We’re happy to work with you anytime to think through what would be best for your environments. Please feel free to reach out to schedule a time to dig into that with us.
Question: Do you have a way for third parties to pull this information, authentication by 0auth, token, etc.?
Answer: The single sign-on subsystem itself will generate evidence on your single sign-on side, whether it’s GSuite, Okta, etc.. There will be a trail showing who logged in at which moment, and this will correspond to a login event in our activity stream. If you’re sending an activity stream from ‘sdm audit’ to another system, you will be able to correlate those events.
In terms of native support for other third parties, like a SIM or security log aggregation, we don’t have a configuration screen for setting that up, but we work with customers to adapt the command line to their particular environments, so definitely give us a call if you’d like our help with that.
Question: Regarding logs that are stored in the relay—StrongDM was set up by my predecessor. For security purposes they wanted to eliminate as much of our data going into exterior systems as possible. Any advice on how I can take local logs and leverage some of these tools, if that’s an option?
Answer: There are two primary stores for logging detail that can be used interchangeably or in parallel. Commands like ‘sdm-audit-users’ aren’t being logged on your gateways and relays so the state of your configuration is always stored in StrongDM. For most of those subcommands, the retention period doesn't even apply—you can always look back and know who was configuring what at any point in your StrongDM installation.
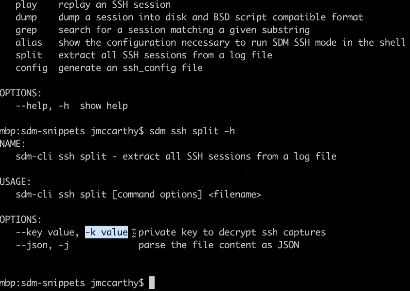
For commands that capture the plain text and the bodies of an SSH session or a database query, those will be logged in JSON, CSV, or some other format that might be too raw to use. In the case of database queries, they’re quite legible and can be used by any log aggregation system, but to get a session playback that’s readable, you need to take additional steps. These are also present in our CLI, which you can see in the image below.
‘sdm ssh split’ is the initial tool you’d use to go into a directory full of files and convert them into playable individual sessions. There’s also pervasive use of -k (highlighted below), in the case where you’ve provided an encryption key. In your log configuration, if you want to perform encryption on some of those logs the files will all be in cryptext.
Question: Is there a way to forward the logs to Google Security Command Center?
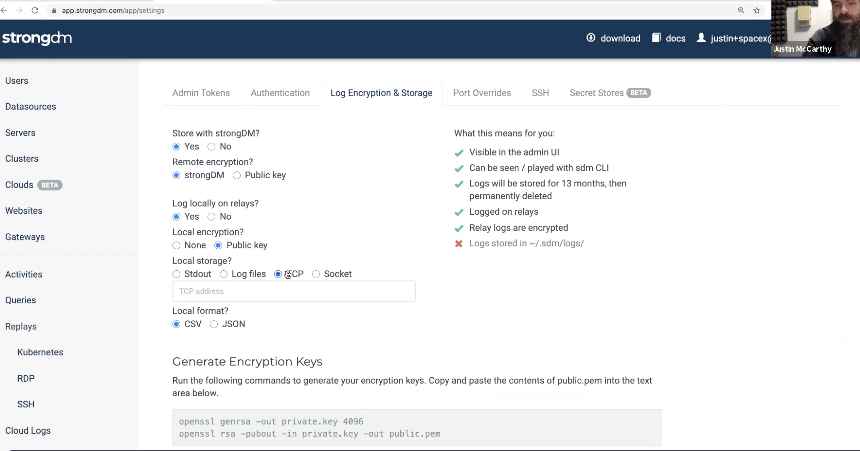
Answer: In our settings screen below, you can see that all our outputs are written assuming the existence of a generic collector. Those systems typically have an agent, a TCP listener, or a socket file. This is the out-of-the-box set of configurations we have today.
We have an example of exporting logs into Amazon Cloudwatch, so you could start with that recipe and convert it to however Google prefers to ingest those logs.
Question: Can you talk about how to identify whether passwords were rotated using the CLI?
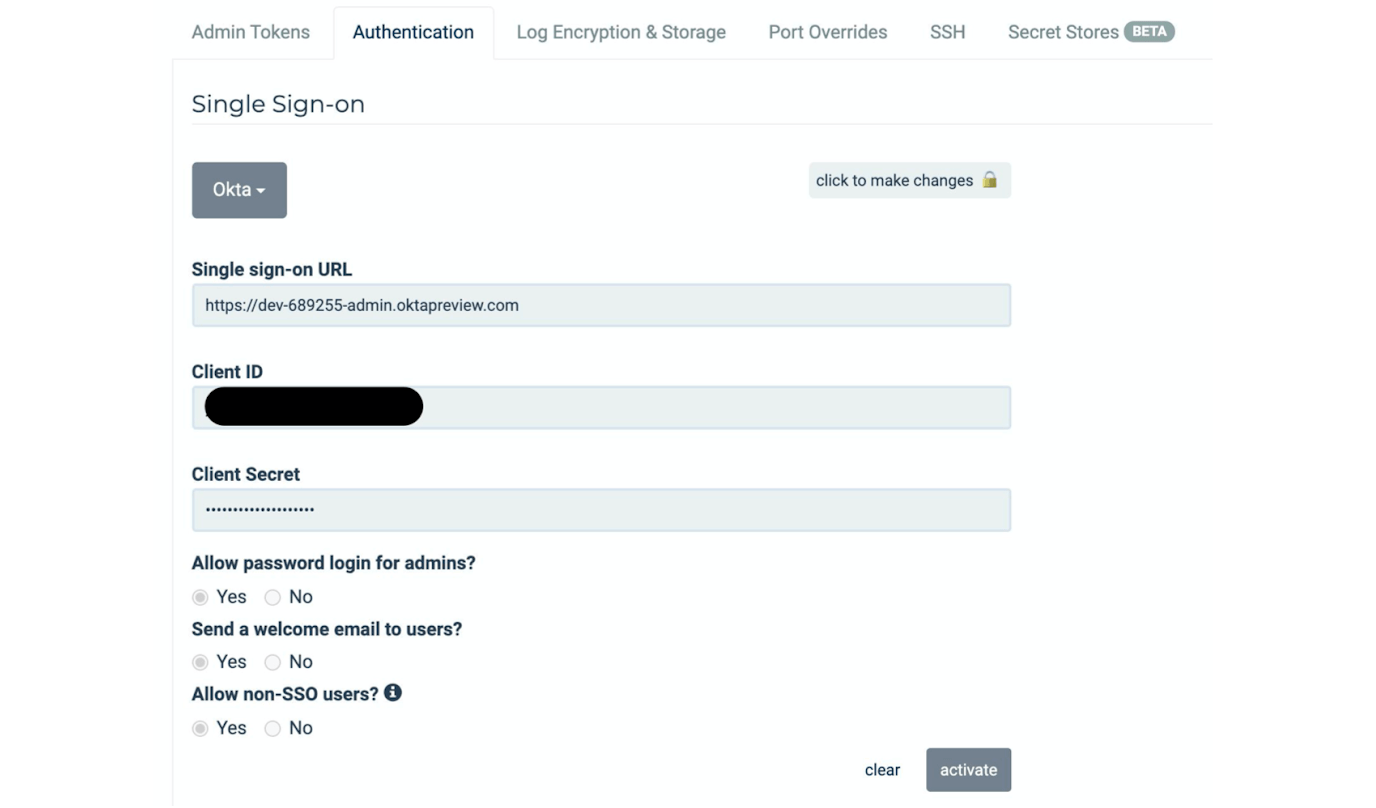
Answer: In the image below, all our user authentication is delegated to Okta. For end users logging in, as far as StrongDM is concerned, there are no passwords; Okta handles everything on the user authentication side of it.
On the underlying resources side, if you had a process in place, where for each target system you automated password rotation, then you would hook into that automation and update the password in the StrongDM system. As you perform that update, you’ll get an activity that says who updated it. You could have an automation, like a token called password rotation service, that would only be allowed to update your resources. If you then hooked that into your existing automation for rotation, you’d see if it was updated.
Going Forward
We’re excited about aligning the way the StrongDM Role system works with the way Active Directory, Okta, and the other major directory systems work. We’re making the StrongDM system congruent with the way you organize your groups in Active Directory.
There’s a related portion of that, that’s part of achieving that outcome: access rules. And we’ll have more to say about that soon. In the meantime, you’re always welcome to reach out to us for advice. We’re happy to help you think through, plan, and generate a strategy with you. Please let us know what topics you’d like to learn more about.
Missed the webinar? You can catch the replay here. And if you’d like to learn more about using StrongDM to ease your SOC 2 audit, book your no BS Demo today.
To learn more on how StrongDM helps companies with SOC 2 compliance, make sure to check out our SOC 2 Compliance Use Case.
You May Also Like

As your organization pursues your SOC 2 certification, organization is critical. You will be busy actively managing dozens of ongoing daily tasks, which can bury you in minutiae. But at the same time, you need to keep your high-level compliance goals in focus in order to successfully move your certification over the finish line.

Whether you’re looking to achieve SOC 2 compliance, or just want to learn more about it, your Googling is bound to lead you to a wealth of articles chock full of buzzwords and acronym soup. In this post, we will provide a guide with definitions, links and resources to gain a solid understanding of everything you need to know about SOC 2 audits.

In this post, we will help you get started with a hierarchy to follow, as well as a summary of each individual SOC 2 policy.

A software development lifecycle (SDLC) policy helps your company not suffer a similar fate by ensuring software goes through a testing process, is built as securely as possible, and that all development work is compliant as it relates to any regulatory guidelines and business needs.Here are some primary topics your software development lifecycle policy and software development methodology should cover